
In former versions of DFM or whatever it was called now, I was able to chart individual CPU’s in Performance Manager. Now, I only see an average across all processors w/ 2.x OnCommand Performance Manager. I know I can drop down to the console, and run a sysstat -whatever... but was wondering if I was missing something for OnCommand Performance Manager to see, or graph individual CPUs. Is this an option, or how would I enable, setup? I am running the LOD, and can't see how this can be done... If its not available, that was of value to some of my customers.
Steve

Hi Steve,
I ended up having to follow NetApp’s instructions on sending OCPM data to Graphite (and later Grafana via the NetApp harvest toolbox tool), then graphing the individual CPU counters. OCPM just tracks “utilization” of the node, which is just not helpful.
On Apr 21, 2016, at 11:28 AM, Klise, Steve Steve.Klise@wwt.com wrote:
In former versions of DFM or whatever it was called now, I was able to chart individual CPU’s in Performance Manager. Now, I only see an average across all processors w/ 2.x OnCommand Performance Manager. I know I can drop down to the console, and run a sysstat -whatever... but was wondering if I was missing something for OnCommand Performance Manager to see, or graph individual CPUs. Is this an option, or how would I enable, setup? I am running the LOD, and can't see how this can be done... If its not available, that was of value to some of my customers.
Steve
Toasters mailing list Toasters@teaparty.net http://www.teaparty.net/mailman/listinfo/toasters

utilization is supposed to include CPU load, kahuna load and disk busy % as factors in it¹s value.
In theory, it should make a better metric for node utilization than just CPU cores by themselves. While I recognize that is not really helpful if you are trying to do a deep dive into Œwhy¹ things are happening on a given node, OPM is supposed to make it easy for you to alarm on Œperformance of node is going¹, without having to do if cpu > x and kahuna
y and disk busy > z then page me that the controller is melting.
Paul Flores Professional Services Consultant 3 Americas Performance Assessments Team NetApp 281-857-6981 Direct Phone 713-446-5219 Mobile Phone paul.flores@netapp.com
http://www.netapp.com/us/media/ds-3444.pdf http://www.netapp.com/us/solutions/professional/assessment.html
On 4/21/16, 10:33 AM, "toasters-bounces@teaparty.net on behalf of Scott Eno" <toasters-bounces@teaparty.net on behalf of s.eno@me.com> wrote:
Hi Steve,
I ended up having to follow NetApp¹s instructions on sending OCPM data to Graphite (and later Grafana via the NetApp harvest toolbox tool), then graphing the individual CPU counters. OCPM just tracks ³utilization² of the node, which is just not helpful.
On Apr 21, 2016, at 11:28 AM, Klise, Steve Steve.Klise@wwt.com wrote:
In former versions of DFM or whatever it was called now, I was able to chart individual CPU¹s in Performance Manager. Now, I only see an average across all processors w/ 2.x OnCommand Performance Manager. I know I can drop down to the console, and run a sysstat -whatever... but was wondering if I was missing something for OnCommand Performance Manager to see, or graph individual CPUs. Is this an option, or how would I enable, setup? I am running the LOD, and can't see how this can be done... If its not available, that was of value to some of my customers.
Steve
Toasters mailing list Toasters@teaparty.net http://www.teaparty.net/mailman/listinfo/toasters
Toasters mailing list Toasters@teaparty.net http://www.teaparty.net/mailman/listinfo/toasters
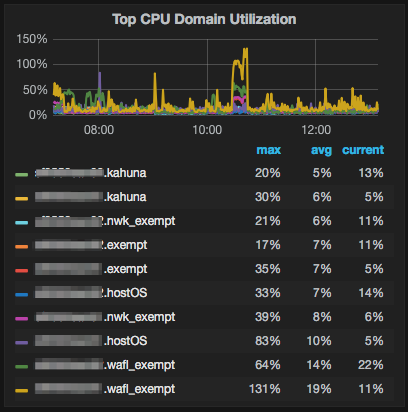
Don’t know if we’re allowed to attach images, but I’ll try. If you can see the attached image, you see that marrying OCPM -> NetApp Harvest -> Grafana you get a really nice breakdown of these processes.
Sadly no alerting, just monitoring.
On Apr 21, 2016, at 1:07 PM, Flores, Paul Paul.Flores@netapp.com wrote:
utilization is supposed to include CPU load, kahuna load and disk busy % as factors in it¹s value.
In theory, it should make a better metric for node utilization than just CPU cores by themselves. While I recognize that is not really helpful if you are trying to do a deep dive into Œwhy¹ things are happening on a given node, OPM is supposed to make it easy for you to alarm on Œperformance of node is going¹, without having to do if cpu > x and kahuna
y and disk busy > z then page me that the controller is melting.
Paul Flores Professional Services Consultant 3 Americas Performance Assessments Team NetApp 281-857-6981 Direct Phone 713-446-5219 Mobile Phone paul.flores@netapp.com
http://www.netapp.com/us/media/ds-3444.pdf http://www.netapp.com/us/solutions/professional/assessment.html
On 4/21/16, 10:33 AM, "toasters-bounces@teaparty.net on behalf of Scott Eno" <toasters-bounces@teaparty.net on behalf of s.eno@me.com> wrote:
Hi Steve,
I ended up having to follow NetApp¹s instructions on sending OCPM data to Graphite (and later Grafana via the NetApp harvest toolbox tool), then graphing the individual CPU counters. OCPM just tracks ³utilization² of the node, which is just not helpful.
On Apr 21, 2016, at 11:28 AM, Klise, Steve Steve.Klise@wwt.com wrote:
In former versions of DFM or whatever it was called now, I was able to chart individual CPU¹s in Performance Manager. Now, I only see an average across all processors w/ 2.x OnCommand Performance Manager. I know I can drop down to the console, and run a sysstat -whatever... but was wondering if I was missing something for OnCommand Performance Manager to see, or graph individual CPUs. Is this an option, or how would I enable, setup? I am running the LOD, and can't see how this can be done... If its not available, that was of value to some of my customers.
Steve
Toasters mailing list Toasters@teaparty.net http://www.teaparty.net/mailman/listinfo/toasters
Toasters mailing list Toasters@teaparty.net http://www.teaparty.net/mailman/listinfo/toasters

There's nothing really to alert from here. Use their utilization metris. Sent from Yahoo Mail on Android
On Thu, Apr 21, 2016 at 10:13, Scott Enos.eno@me.com wrote: Don’t know if we’re allowed to attach images, but I’ll try. If you can see the attached image, you see that marrying OCPM -> NetApp Harvest -> Grafana you get a really nice breakdown of these processes. Sadly no alerting, just monitoring.
On Apr 21, 2016, at 1:07 PM, Flores, Paul Paul.Flores@netapp.com wrote: utilization is supposed to include CPU load, kahuna load and disk busy % as factors in it¹s value.
In theory, it should make a better metric for node utilization than just CPU cores by themselves. While I recognize that is not really helpful if you are trying to do a deep dive into Œwhy¹ things are happening on a given node, OPM is supposed to make it easy for you to alarm on Œperformance of node is going¹, without having to do if cpu > x and kahuna
y and disk busy > z then page me that the controller is melting.
Paul Flores Professional Services Consultant 3 Americas Performance Assessments Team NetApp 281-857-6981 Direct Phone 713-446-5219 Mobile Phone paul.flores@netapp.com
http://www.netapp.com/us/media/ds-3444.pdf http://www.netapp.com/us/solutions/professional/assessment.html
On 4/21/16, 10:33 AM, "toasters-bounces@teaparty.net on behalf of Scott Eno" <toasters-bounces@teaparty.net on behalf of s.eno@me.com> wrote:
Hi Steve,
I ended up having to follow NetApp¹s instructions on sending OCPM data to Graphite (and later Grafana via the NetApp harvest toolbox tool), then graphing the individual CPU counters. OCPM just tracks ³utilization² of the node, which is just not helpful.
On Apr 21, 2016, at 11:28 AM, Klise, Steve Steve.Klise@wwt.com wrote:
In former versions of DFM or whatever it was called now, I was able to chart individual CPU¹s in Performance Manager. Now, I only see an average across all processors w/ 2.x OnCommand Performance Manager. I know I can drop down to the console, and run a sysstat -whatever... but was wondering if I was missing something for OnCommand Performance Manager to see, or graph individual CPUs. Is this an option, or how would I enable, setup? I am running the LOD, and can't see how this can be done... If its not available, that was of value to some of my customers.
Steve
_______________________________________________ Toasters mailing list Toasters@teaparty.net http://www.teaparty.net/mailman/listinfo/toasters
_______________________________________________ Toasters mailing list Toasters@teaparty.net http://www.teaparty.net/mailman/listinfo/toasters
_______________________________________________ Toasters mailing list Toasters@teaparty.net http://www.teaparty.net/mailman/listinfo/toasters
Those are good if you want to know more about _why_ your utilization metric is high, but looking at them on their own is only part of the story. Nothing you see by looking at the domains is going to help you _more_ than just monitoring utilization, because utilization _includes_ the only domain that could cause you pain by being over utilized.
PF
From: Scott Eno <s.eno@me.commailto:s.eno@me.com> Date: Thursday, April 21, 2016 at 12:13 PM To: Paul Flores <Paul.Flores@netapp.commailto:Paul.Flores@netapp.com> Cc: "NGC-steve.klise-wwt.com" <steve.klise@wwt.commailto:steve.klise@wwt.com>, Toasters <toasters@teaparty.netmailto:toasters@teaparty.net> Subject: Re: OnCommand CPU report question for 2.x OPM
Don’t know if we’re allowed to attach images, but I’ll try. If you can see the attached image, you see that marrying OCPM -> NetApp Harvest -> Grafana you get a really nice breakdown of these processes.
Sadly no alerting, just monitoring.
[cid:76074662-6C1F-41B6-B055-001567F698C1]
On Apr 21, 2016, at 1:07 PM, Flores, Paul <Paul.Flores@netapp.commailto:Paul.Flores@netapp.com> wrote:
utilization is supposed to include CPU load, kahuna load and disk busy % as factors in it¹s value.
In theory, it should make a better metric for node utilization than just CPU cores by themselves. While I recognize that is not really helpful if you are trying to do a deep dive into Œwhy¹ things are happening on a given node, OPM is supposed to make it easy for you to alarm on Œperformance of node is going¹, without having to do if cpu > x and kahuna y and disk busy > z then page me that the controller is melting.
Paul Flores Professional Services Consultant 3 Americas Performance Assessments Team NetApp 281-857-6981 Direct Phone 713-446-5219 Mobile Phone paul.flores@netapp.commailto:paul.flores@netapp.com
http://www.netapp.com/us/media/ds-3444.pdf http://www.netapp.com/us/solutions/professional/assessment.html
On 4/21/16, 10:33 AM, "toasters-bounces@teaparty.netmailto:toasters-bounces@teaparty.net on behalf of Scott Eno" <toasters-bounces@teaparty.netmailto:toasters-bounces@teaparty.net on behalf of s.eno@me.commailto:s.eno@me.com> wrote:
Hi Steve,
I ended up having to follow NetApp¹s instructions on sending OCPM data to Graphite (and later Grafana via the NetApp harvest toolbox tool), then graphing the individual CPU counters. OCPM just tracks ³utilization² of the node, which is just not helpful.
On Apr 21, 2016, at 11:28 AM, Klise, Steve <Steve.Klise@wwt.commailto:Steve.Klise@wwt.com> wrote:
In former versions of DFM or whatever it was called now, I was able to chart individual CPU¹s in Performance Manager. Now, I only see an average across all processors w/ 2.x OnCommand Performance Manager. I know I can drop down to the console, and run a sysstat -whatever... but was wondering if I was missing something for OnCommand Performance Manager to see, or graph individual CPUs. Is this an option, or how would I enable, setup? I am running the LOD, and can't see how this can be done... If its not available, that was of value to some of my customers.
Steve
_______________________________________________ Toasters mailing list Toasters@teaparty.netmailto:Toasters@teaparty.net http://www.teaparty.net/mailman/listinfo/toasters
_______________________________________________ Toasters mailing list Toasters@teaparty.netmailto:Toasters@teaparty.net http://www.teaparty.net/mailman/listinfo/toasters

If by "montoring utilisation" Paul means this PC:
system:system:cpu_busy
(N.B. the formula that calculates this inside the Counter Mgr changed in 8.2.1 both 7- & c-mode)
...then yes, it includes the highest utilised *single threaded* kernel domain. Serial domains are all except *_exempt, wafl_xcleaner (2 threads), hostOS. For a recent/modern ONTAP that is, don't trust this if you're still on some old version!
The formula for calculating it is like this:
MAX(system:system:average_processor_busy, MAX(util_of(s-threaded domain1, s-threaded domain2,... domain10))
and it has been since 8.2.1 and still is in all 8.3 rels to this date.
There are 10 of these s-threaded domains. You can see them in statit output. The multi-threaded ones are not counted here in other words, but those can give you problems too. Not just wafl_exempt, which is where WAFL executes mostly (hopefully!) (it's sometimes called parallel-Kahuna).
The domain named Kahuna in statit output, is the only one included in the new Node Utilisation metric, which also includes something called B2B CP margin. s-Kahuna is the most dominant source of overload in this "domain" area, that said I've had systems suffer from overload of other single threaded domains too. And multi-threaded ones as well, there have been ONTAP bugs causing nwk_exempt to over utilise (that was *not* pleasant and hard to find). Under normal circumstances this would be really rare
The formula for the new Node Utilisation metric is basically like this:
system:system:node_util = MAX(system:system:avg_processor_busy, 100-system:system:b2b_cp_margin, MAX(single threaded domain{1,2,3,...} utilization))
The main reason for avoiding system:system:cpu_busy here, is that it's been so plagued over the years by showing the wrong (= not interesting!) thing that misunderstandings have been abundant and controversy just never seems to end around it
Anyway. 'Node Utilisation' aims to calculate, a ballpark estimate, how much "head room" there's left until the system will get into B2B CP "too much" (not the odd one, that's OK and most often not noticeable by the application /users). To do the calculation, you need to know the utilisation of the disks in the Raid Groups inside the system -- something which isn't that easy to do. There's no single PC in the CM (Counter Mgr) which will give you the equiv of what sysstat -x calls "Disk Util" -- that col will show the most utilised drive in the whole system for each iteration. I.o.w. it can be a different drive each iteration of sysstat (which is quite OK).
For scripting and doing things yourself, you pretty much have to extract *all* the util counters from *all* the drives in the system and then post process them all. In a big system, with many 100 of disks, this becomes quite cumbersome
However, the utilisation of a drive is not as obvious a metric as one may think. It seems simple; it's measured internally by the system at a 1 KHz rate -- is there a command on the disk or not?
But there is a caveat... apparently (as Paul Flores informed me recently) the "yes" answer to the Q is actually "is there data going in/out of the disk right now?" Meaning that if a drive is *really* *really* busy, so d**n busy that it spends a lot of time seeking, then the util metric will actually "lie" to you. It will go down even if the disk is busier than ever. I'm thinking that this probably doesn't matter much IRL, because it's literally only slow (7.2K rpm, large) drives which could ever get into this state -- and if your system would end up in this state you're in deep s**t anyway and there's no remedy except a reboot or kill *all* the workload generators to release the I/O pressure
Think of it as a motorway completely jammed up, no car can move anywhere. How do you "fix" it? A: close *all* the entrance ramps, and just wait. It will drain out after a while
Hope this was helpful to ppl, sorry for the length of this text but these things are quite complex and I don't want to add to confusion or cause misunderstandings more than absolutely necessary
/M
On 2016-04-21 19:47, Flores, Paul wrote:
Those are good if you want to know more about _why_ your utilization metric is high, but looking at them on their own is only part of the story. Nothing you see by looking at the domains is going to help you _more_ than just monitoring utilization, because utilization _includes_ the only domain that could cause you pain by being over utilized.
PF
From: Scott Eno <s.eno@me.com mailto:s.eno@me.com> Date: Thursday, April 21, 2016 at 12:13 PM To: Paul Flores <Paul.Flores@netapp.com mailto:Paul.Flores@netapp.com> Cc: "NGC-steve.klise-wwt.com" <steve.klise@wwt.com mailto:steve.klise@wwt.com>, Toasters <toasters@teaparty.net mailto:toasters@teaparty.net> Subject: Re: OnCommand CPU report question for 2.x OPM
Don’t know if we’re allowed to attach images, but I’ll try. If you can see the attached image, you see that marrying OCPM -> NetApp Harvest -> Grafana you get a really nice breakdown of these processes.
Sadly no alerting, just monitoring.
"CPU" isn't a plagued reading..
It's just irrelevant.
People work VERY VERY hard (including here) to make Ontap look like a linux box with smoothly threading (to infinity) processes to get things done evenly across all resources.
Utopia.
It's not...no matter how hard people try.
Now..being SO visible, and SO informatically driven via sysstat, sysstat -M, and a multitude of other ways to "view" it, one could come to a conclusion that it _MEANS_ something...it HAS to...
But really...
_________________________________Jeff MohlerTech Yahoo, Storage Architect, Principal(831)454-6712 YPAC Gold Member Twitter: @PrincipalYahoo CorpIM: Hipchat & Iris
On Thursday, April 21, 2016 12:11 PM, Michael Bergman michael.bergman@ericsson.com wrote:
If by "montoring utilisation" Paul means this PC:
system:system:cpu_busy
(N.B. the formula that calculates this inside the Counter Mgr changed in 8.2.1 both 7- & c-mode)
...then yes, it includes the highest utilised *single threaded* kernel domain. Serial domains are all except *_exempt, wafl_xcleaner (2 threads), hostOS. For a recent/modern ONTAP that is, don't trust this if you're still on some old version!
The formula for calculating it is like this:
MAX(system:system:average_processor_busy, MAX(util_of(s-threaded domain1, s-threaded domain2,... domain10))
and it has been since 8.2.1 and still is in all 8.3 rels to this date.
There are 10 of these s-threaded domains. You can see them in statit output. The multi-threaded ones are not counted here in other words, but those can give you problems too. Not just wafl_exempt, which is where WAFL executes mostly (hopefully!) (it's sometimes called parallel-Kahuna).
The domain named Kahuna in statit output, is the only one included in the new Node Utilisation metric, which also includes something called B2B CP margin. s-Kahuna is the most dominant source of overload in this "domain" area, that said I've had systems suffer from overload of other single threaded domains too. And multi-threaded ones as well, there have been ONTAP bugs causing nwk_exempt to over utilise (that was *not* pleasant and hard to find). Under normal circumstances this would be really rare
The formula for the new Node Utilisation metric is basically like this:
system:system:node_util = MAX(system:system:avg_processor_busy, 100-system:system:b2b_cp_margin, MAX(single threaded domain{1,2,3,...} utilization))
The main reason for avoiding system:system:cpu_busy here, is that it's been so plagued over the years by showing the wrong (= not interesting!) thing that misunderstandings have been abundant and controversy just never seems to end around it
Anyway. 'Node Utilisation' aims to calculate, a ballpark estimate, how much "head room" there's left until the system will get into B2B CP "too much" (not the odd one, that's OK and most often not noticeable by the application /users). To do the calculation, you need to know the utilisation of the disks in the Raid Groups inside the system -- something which isn't that easy to do. There's no single PC in the CM (Counter Mgr) which will give you the equiv of what sysstat -x calls "Disk Util" -- that col will show the most utilised drive in the whole system for each iteration. I.o.w. it can be a different drive each iteration of sysstat (which is quite OK).
For scripting and doing things yourself, you pretty much have to extract *all* the util counters from *all* the drives in the system and then post process them all. In a big system, with many 100 of disks, this becomes quite cumbersome
However, the utilisation of a drive is not as obvious a metric as one may think. It seems simple; it's measured internally by the system at a 1 KHz rate -- is there a command on the disk or not?
But there is a caveat... apparently (as Paul Flores informed me recently) the "yes" answer to the Q is actually "is there data going in/out of the disk right now?" Meaning that if a drive is *really* *really* busy, so d**n busy that it spends a lot of time seeking, then the util metric will actually "lie" to you. It will go down even if the disk is busier than ever. I'm thinking that this probably doesn't matter much IRL, because it's literally only slow (7.2K rpm, large) drives which could ever get into this state -- and if your system would end up in this state you're in deep s**t anyway and there's no remedy except a reboot or kill *all* the workload generators to release the I/O pressure
Think of it as a motorway completely jammed up, no car can move anywhere. How do you "fix" it? A: close *all* the entrance ramps, and just wait. It will drain out after a while
Hope this was helpful to ppl, sorry for the length of this text but these things are quite complex and I don't want to add to confusion or cause misunderstandings more than absolutely necessary
/M
On 2016-04-21 19:47, Flores, Paul wrote:
Those are good if you want to know more about _why_ your utilization metric is high, but looking at them on their own is only part of the story. Nothing you see by looking at the domains is going to help you _more_ than just monitoring utilization, because utilization _includes_ the only domain that could cause you pain by being over utilized.
PF
From: Scott Eno <s.eno@me.com mailto:s.eno@me.com> Date: Thursday, April 21, 2016 at 12:13 PM To: Paul Flores <Paul.Flores@netapp.com mailto:Paul.Flores@netapp.com> Cc: "NGC-steve.klise-wwt.com" <steve.klise@wwt.com mailto:steve.klise@wwt.com>, Toasters <toasters@teaparty.net mailto:toasters@teaparty.net> Subject: Re: OnCommand CPU report question for 2.x OPM
Don’t know if we’re allowed to attach images, but I’ll try. If you can see the attached image, you see that marrying OCPM -> NetApp Harvest -> Grafana you get a really nice breakdown of these processes.
Sadly no alerting, just monitoring.
_______________________________________________ Toasters mailing list Toasters@teaparty.net http://www.teaparty.net/mailman/listinfo/toasters
Ok so two things (comments).
1. I believe Paul meant the new metric 'Node Utilisation' in his reply. N.B. there's no PC in the CM or anything like that for it, it's only inside OCPM
Since it's actually currently defined like this (I *think*):
system:system:node_util = MAX(system:system:avg_processor_busy, # Normalized to 85 100-system:system:b2b_cp_margin, <Kahuna utilisation>) # Normalized to 50
what Paul wrote makes sense:
[...] because utilization _includes_ the only domain that could cause you pain by being over utilized.
2. Pls note! There's no Performance Counter in the CM called system:system:b2b_cp_margin system:system:node_util.
It's just a notation I used to make it clear and stringent. I think there probably *should* be such PCs, in the future!
My general view is that Kahuna isn't the only serial domain that can cause you pain by being over utilised. It's not common, rare rather, that any of the other 9 can bottleneck a system, but it can (and has) happened. And, as I wrote before, you can get hurt by over utilised multi-threaded domains too. Again, it's not that common though personally I think that it would make a lot of sense to include at least a few of those domains in the overall fomula for 'Node Util' as well. R&D efforts is ongoing I'm sure :-)
The main argument about Kahuna being so dominant in causing trouble is heavy CIFS workload. SMB operations which have to be serialised, and are done a lot... :-(
That said: my very humble opinion is that since ONTAP 8.2.1 system:system:cpu_busy actually isn't that bad at all. If you know what it shows, and how it's calculated it tells you stuff about utilisation of some or other of the 10 serial domains inside the system. Point being: it may not be Kahuna (even if it most often is). I've watched our systems for long periods of time, looking at the difference between these two in parallel:
system:system:cpu_busy system:system:avg_processor_busy
while at the same time running sysstat -M. Conclusion: it's not at all always Kahuna that makes the former go up now and then. It's been a bit of a mystery at times, as I've had trouble matching it together so that I can tell which of the 10 single threaded domains is causing cpu_busy to increase during some measurement intervals. I need to do more with this, the data shown by sysstat -M is in the CM as PC as well so it's better to use 'stats show' in the node shell to look at it
Hope this helps, /M
On 2016-04-21 21:11, Michael Bergman wrote:
If by "montoring utilisation" Paul means this PC:
system:system:cpu_busy
(N.B. the formula that calculates this inside the Counter Mgr changed in 8.2.1 both 7- & c-mode)
...then yes, it includes the highest utilised *single threaded* kernel domain. Serial domains are all except *_exempt, wafl_xcleaner (2 threads), hostOS. For a recent/modern ONTAP that is, don't trust this if you're still on some old version!
The formula for calculating it is like this:
MAX(system:system:average_processor_busy, MAX(util_of(s-threaded domain1, s-threaded domain2,... domain10))
and it has been since 8.2.1 and still is in all 8.3 rels to this date. [...]
Thank you everyone for the great info.. Learn something new everyday! Steve
On 4/21/16, 1:27 PM, "toasters-bounces@teaparty.net on behalf of Michael Bergman" <toasters-bounces@teaparty.net on behalf of michael.bergman@ericsson.com> wrote:
Ok so two things (comments).
I believe Paul meant the new metric 'Node Utilisation' in his reply. N.B. there's no PC in the CM or anything like that for it, it's only inside OCPM
Since it's actually currently defined like this (I *think*):
system:system:node_util = MAX(system:system:avg_processor_busy, # Normalized to 85 100-system:system:b2b_cp_margin, <Kahuna utilisation>) # Normalized to 50
what Paul wrote makes sense:
[...] because utilization _includes_ the only domain that could cause you pain by being over utilized.
Pls note! There's no Performance Counter in the CM called system:system:b2b_cp_margin system:system:node_util.
It's just a notation I used to make it clear and stringent. I think there probably *should* be such PCs, in the future!
My general view is that Kahuna isn't the only serial domain that can cause you pain by being over utilised. It's not common, rare rather, that any of the other 9 can bottleneck a system, but it can (and has) happened. And, as I wrote before, you can get hurt by over utilised multi-threaded domains too. Again, it's not that common though personally I think that it would make a lot of sense to include at least a few of those domains in the overall fomula for 'Node Util' as well. R&D efforts is ongoing I'm sure :-)
The main argument about Kahuna being so dominant in causing trouble is heavy CIFS workload. SMB operations which have to be serialised, and are done a lot... :-(
That said: my very humble opinion is that since ONTAP 8.2.1 system:system:cpu_busy actually isn't that bad at all. If you know what it shows, and how it's calculated it tells you stuff about utilisation of some or other of the 10 serial domains inside the system. Point being: it may not be Kahuna (even if it most often is). I've watched our systems for long periods of time, looking at the difference between these two in parallel:
system:system:cpu_busy system:system:avg_processor_busy
while at the same time running sysstat -M. Conclusion: it's not at all always Kahuna that makes the former go up now and then. It's been a bit of a mystery at times, as I've had trouble matching it together so that I can tell which of the 10 single threaded domains is causing cpu_busy to increase during some measurement intervals. I need to do more with this, the data shown by sysstat -M is in the CM as PC as well so it's better to use 'stats show' in the node shell to look at it
Hope this helps, /M
On 2016-04-21 21:11, Michael Bergman wrote:
If by "montoring utilisation" Paul means this PC:
system:system:cpu_busy
(N.B. the formula that calculates this inside the Counter Mgr changed in 8.2.1 both 7- & c-mode)
...then yes, it includes the highest utilised *single threaded* kernel domain. Serial domains are all except *_exempt, wafl_xcleaner (2 threads), hostOS. For a recent/modern ONTAP that is, don't trust this if you're still on some old version!
The formula for calculating it is like this:
MAX(system:system:average_processor_busy, MAX(util_of(s-threaded domain1, s-threaded domain2,... domain10))
and it has been since 8.2.1 and still is in all 8.3 rels to this date. [...]
Toasters mailing list Toasters@teaparty.net http://www.teaparty.net/mailman/listinfo/toasters
Thanks I forgot about the b2b CP measure as well. :)
The reasons that the node utilization metric works off of Kahuna and not off of Kahu (the other serialized domain) are varied and subject to another long winded discussion, but if you look at how things are handled in bento, you will see that Kahuna affects the ENTIRE systems¹ ability to do work, and will over-ride Kahu (parallelized serial work down in the lower affinities)
as more user workload migrates into the lower affinities (volume/aggr and the like), Kahuna usage becomes less of a potential workload bottleneck, however the possibility exists, if we get some kind of bug that drops things into that processing domain, that it can and will pre-empt everything going on beneath it.
So, for example, in 8.2, since we are still doing some CIFS things in Kahuna, it¹s possible for a small CIFS workload to pre-empt a busier NFS workload, due to the amount of serial processing being demanded. It would NOT be possible for that busier NFS Œserialized¹ workload to cause CIFS meta-data type stuff happening in Kahuna to slow down, since Kahuna and Kahu are mutually exclusive execution wise, and Kahuna has priority over Kahu.
going to 8.3, this is not so much of a problem, but the fact remains, the architecture of the software is such that Kahuna is a high priority workload domain, so anything dropping into it has the potential to disrupt work going on in other parts of the system I.E. it represents a potential bottleneck to performance, and is an important thing to track when you want to represent Node Utilization.
A lot of people are listening to how folks want an Œeasy¹ button for headroom. its going to continue to get better, as OnTap gets a handle on spreading the user workload more evenly across more cores, IMHO.
PF
On 4/21/16, 3:27 PM, "toasters-bounces@teaparty.net on behalf of Michael Bergman" <toasters-bounces@teaparty.net on behalf of michael.bergman@ericsson.com> wrote:
Ok so two things (comments).
I believe Paul meant the new metric 'Node Utilisation' in his reply. N.B. there's no PC in the CM or anything like that for it, it's only inside OCPM
Since it's actually currently defined like this (I *think*):
system:system:node_util = MAX(system:system:avg_processor_busy, # Normalized to 85 100-system:system:b2b_cp_margin, <Kahuna utilisation>) # Normalized to 50
what Paul wrote makes sense:
[...] because utilization _includes_ the only domain that could cause you pain by being over utilized.
Pls note! There's no Performance Counter in the CM called system:system:b2b_cp_margin system:system:node_util.
It's just a notation I used to make it clear and stringent. I think there probably *should* be such PCs, in the future!
My general view is that Kahuna isn't the only serial domain that can cause you pain by being over utilised. It's not common, rare rather, that any of the other 9 can bottleneck a system, but it can (and has) happened. And, as I wrote before, you can get hurt by over utilised multi-threaded domains too. Again, it's not that common though personally I think that it would make a lot of sense to include at least a few of those domains in the overall fomula for 'Node Util' as well. R&D efforts is ongoing I'm sure :-)
The main argument about Kahuna being so dominant in causing trouble is heavy CIFS workload. SMB operations which have to be serialised, and are done a lot... :-(
That said: my very humble opinion is that since ONTAP 8.2.1 system:system:cpu_busy actually isn't that bad at all. If you know what it shows, and how it's calculated it tells you stuff about utilisation of some or other of the 10 serial domains inside the system. Point being: it may not be Kahuna (even if it most often is). I've watched our systems for long periods of time, looking at the difference between these two in parallel:
system:system:cpu_busy system:system:avg_processor_busy
while at the same time running sysstat -M. Conclusion: it's not at all always Kahuna that makes the former go up now and then. It's been a bit of a mystery at times, as I've had trouble matching it together so that I can tell which of the 10 single threaded domains is causing cpu_busy to increase during some measurement intervals. I need to do more with this, the data shown by sysstat -M is in the CM as PC as well so it's better to use 'stats show' in the node shell to look at it
Hope this helps, /M
On 2016-04-21 21:11, Michael Bergman wrote:
If by "montoring utilisation" Paul means this PC:
system:system:cpu_busy
(N.B. the formula that calculates this inside the Counter Mgr changed in 8.2.1 both 7- & c-mode)
...then yes, it includes the highest utilised *single threaded* kernel domain. Serial domains are all except *_exempt, wafl_xcleaner (2 threads), hostOS. For a recent/modern ONTAP that is, don't trust this if you're still on some old version!
The formula for calculating it is like this:
MAX(system:system:average_processor_busy, MAX(util_of(s-threaded domain1, s-threaded domain2,... domain10))
and it has been since 8.2.1 and still is in all 8.3 rels to this date. [...]
Toasters mailing list Toasters@teaparty.net http://www.teaparty.net/mailman/listinfo/toasters
-
 Flores, Paul
 -
 Jeffrey Mohler
 -
 Klise, Steve
 -
 Michael Bergman
 -
 Scott Eno