
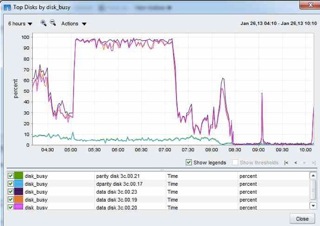
On Nick's advice I setup a job to log both wafltop and ps -c 1 once per minute - and we had a sustained sata0 disk busy from 5am-7am as reported by NMC. First question I have from wafltop show is - what is the first row (sata0::file i/o) reporting ? What could be the source of these 28907 non-volume specific Read IOs?
Application MB Total MB Read(STD) MB Write(STD) Read IOs(STD) Write IOs(STD) ----------- -------- ------------ ------------- ------------- -------------- sata0::file i/o: 5860 5830 30 28907 0 sata0:backup:nfsv3: 608 0 608 31 0
I'm just starting to go through the data
aggr status Aggr State Status Options sata0 online raid_dp, aggr nosnap=on, raidsize=12 64-bit aggr2 online raid_dp, aggr nosnap=on, raidsize=19 64-bit aggr1 online raid_dp, aggr root, nosnap=on, raidsize=14 32-bit na04*> df -Ah Aggregate total used avail capacity aggr1 13TB 11TB 1431GB 89% aggr2 19TB 14TB 5305GB 74% sata0 27TB 19TB 8027GB 72%
thanks
On Jan 25, 2013, at 5:33 PM, Nicholas Bernstein nick@nicholasbernstein.com wrote:
Try doing a 'ps -c 1' or a wafltop show (double check the syntax) while you're getting the spike; those will probably help you narrow down the processes that are using your disks. Both are priv set advanced/diag commands.
Nick